
You have been on the same amount for three weeks. Nothing changed — same day, same pen, same routine — and yet week three feels nothing like week one. It is tempting to read that as your body reacting, or as the medication finally working.
Usually it is something simpler, and entirely predictable: there is more of the drug in you now than there was a week ago, even though you have not taken any more of it.
That is arithmetic, and the numbers behind it are printed in the FDA label for every approved GLP-1. This post explains where they come from and what they mean for the weeks you are in. It is educational, not medical advice — your prescriber decides the amount and the schedule.
Why does a weekly injection keep building up if I take the same amount each time?
Because the next injection arrives before the last one has gone, so what is left over stacks on top of what you just added.
The relevant number is the elimination half-life: the time it takes for the amount in your body to fall by half. For semaglutide, the Ozempic label puts it at approximately one week. For tirzepatide, the Mounjaro label gives approximately five days, and the Zepbound label about five to six days in people with overweight or obesity.
Now put that next to a seven-day gap between injections. If half of an injection is still present when the following one lands, week two does not start from zero. It starts from a half.
Repeat that and the floor keeps rising — quickly at first, then by less each week, until what you clear between injections equals what you put in. That plateau has a name: steady state.
What is a half-life, and what does it not tell you?
A half-life describes timing, not strength. It tells you how fast a drug leaves, not how much effect it has while it is there. Two medications with the same half-life can do entirely different things, and a longer half-life is not a stronger drug.
It is also an average drawn from trial populations, not a promise about you. A 2024 systematic review of semaglutide pharmacokinetics describes a predictable profile across studies, and notes that body weight may affect exposure — while adding that further study is needed to confirm it.
One regulatory note, because it changes what any of this applies to. Compounded semaglutide and tirzepatide are not FDA-approved products: the FDA states that unapproved versions have not been reviewed for safety, effectiveness or quality, and has warned about falsely labelled compounded GLP-1s on the US market. The half-lives above come from approved labels; no approved label covers a compounded preparation.
How long do levels keep climbing before they settle?
About four to five weeks for semaglutide, and about four weeks for tirzepatide, on an unchanged schedule.
Those are the labels' own numbers, not an estimate. The Ozempic label states that steady-state exposure is achieved following four to five weeks of once-weekly administration. The Zepbound label states that steady-state plasma tirzepatide concentrations were achieved following four weeks of once-weekly administration.
Read that with your own calendar next to it. The first month on an unchanged schedule is a rising month, not a flat one. Whatever you notice in week two is happening at a lower internal level than the same week would produce in month three.
What does the arithmetic actually look like, week by week?
The numbers below are ILLUSTRATIVE — they show the shape of the curve, not an amount, and are not anything to act on. Call the peak reached after the very first injection 1.00, whatever that injection happened to be.
For semaglutide, with a half-life of about one week and a weekly interval, the peak after each successive injection runs roughly:
- Injection 1 — 1.00
- Injection 2 — 1.50
- Injection 3 — 1.75
- Injection 4 — 1.88
- Injection 5 — 1.94, settling towards about 2.00
So the settled peak is roughly double that of a single injection — and you are at 50%, 75%, 88% and 94% of it across the first four weeks.
For tirzepatide, taking the Mounjaro label's five-day figure against the same weekly interval, less carries over: 1.00, 1.38, 1.52, 1.58, settling near 1.61. As a share of where it ends up, that is 62%, 86%, 95% and 98%.
The shorter the half-life relative to the gap between injections, the less a medication accumulates and the sooner it levels off. That single relationship explains both labels' timings.

Why is the drug still there weeks after the last injection?
Because the same arithmetic runs in reverse, and it starts from the accumulated level rather than from one injection's worth.
The Ozempic label says that with an elimination half-life of approximately one week, semaglutide will be present in the circulation for about five weeks after the last dose. The Wegovy label puts it at about five to seven weeks. Tirzepatide, clearing faster, falls away over a shorter span.
Illustratively, from a settled peak semaglutide drops to roughly half after a week, a quarter after two, an eighth after three. Tirzepatide falls faster: around 38%, then 14%, then 5%.
Two things follow. A pause is not a reset — a fortnight's gap leaves a substantial amount still circulating. And side effects, or their absence, do not end the day an injection is skipped. This is why the date of your last injection is a fact a prescriber is likely to ask for — and one of the easiest to misremember.
Does "steady state" mean I should feel steady?
No. Steady state describes the amount in your blood across weeks, not how you feel within one.
Levels still rise and fall between injections. At steady state, the illustrative semaglutide trough sits at about half its peak; tirzepatide's at roughly 38% of its. So tirzepatide has the wider weekly swing despite accumulating less — worth knowing if your difficult days cluster at one end of the week.
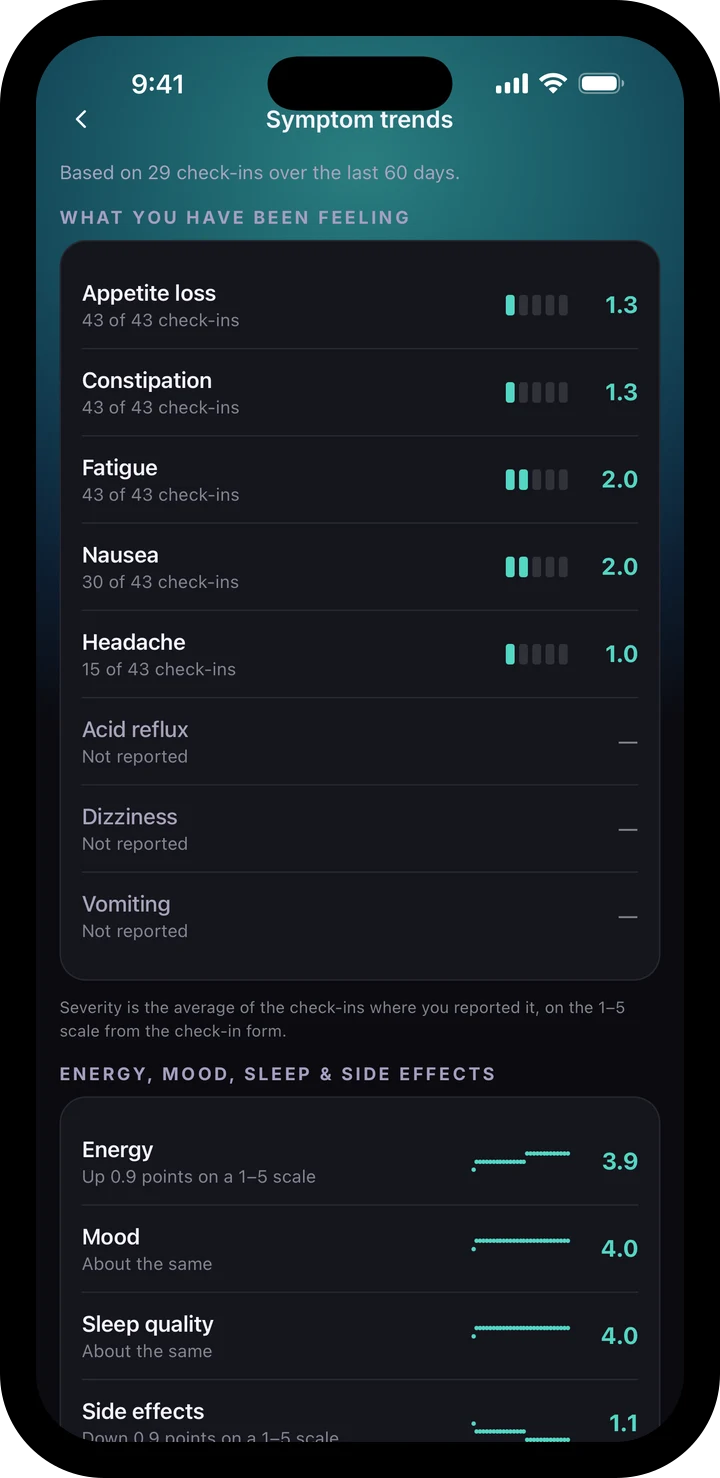
Whether any of that maps onto how you feel is a separate question, and one no curve can answer. Appetite, nausea, sleep and energy respond to a long list of things, of which blood concentration is one. A record simply lets you line your own days up against your own dose dates — the comparison memory is worst at. There is more on what to write down each week in our guide to tracking a GLP-1.
How do I see this curve with my own dates?
The estimated levels calculator draws it for you. Choose the compound and the interval; it plots the accumulation curve across eight injections, marks each one, and lists the peak and trough for every injection in a table beneath — using the published half-lives cited above.
One honest limit, stated on the tool itself: it is a model, not a measurement. The axis is a percentage of a settled peak, never a blood level, because a simplified population model has no business implying the precision of a blood test. It shows you the shape. Your provider is the only person who can interpret your actual levels.
For the curve beside your real dose history, that is what Lumara's GLP-1 tracker is for: the dates you actually injected, the weeks you actually had, on one timeline.