
Your ring said your HRV was 38 this morning. Yesterday it was 61. Nothing happened in between that you can point to — you slept about the same, you did not train, you are not ill — and yet the app has drawn a downward arrow and written a sentence about your recovery.
Or the reverse. Your resting heart rate has crept up three beats over a fortnight and nothing has said a word about it, because three beats trips no threshold anyone has set.
Those are the same problem. You are shown a number without being told how much that number normally moves, so you have no way to tell whether you are looking at a signal or at the ordinary churn of a body doing nothing in particular.
This guide is about closing that gap: what heart-rate variability, resting heart rate and sleep stages actually measure, how much they vary in healthy people who changed nothing, what reliably pushes them around, and how to tell a trend from noise. It is educational, not medical advice. Nothing here is a reason to change a medication — your prescriber decides that.
What do HRV, resting heart rate and sleep stages actually measure?
All three are indirect. None of them measures health; each measures something narrow that health happens to influence, and most of the confusion people have with their own data comes from forgetting that sentence.
Heart-rate variability
HRV is the variation in the gap between one heartbeat and the next. Your heart does not beat like a metronome: the interval between beats stretches and shortens continuously, largely under the control of the autonomic nervous system. HRV is the arithmetic on those intervals — most consumer devices report something close to RMSSD, the root mean square of successive differences, which is weighted toward the fast, parasympathetic side of that control.
The measurement standards for this were set in 1996 by a joint task force of the European Society of Cardiology and the North American Society of Pacing and Electrophysiology, and the part worth carrying away is how conditional the numbers are. The task force was explicit that it is inappropriate to compare HRV measures taken from recordings of different durations, and that recording length and conditions should be standardised instead — it settled on two: a five-minute short-term recording under stable conditions, and a nominal 24 hours. HRV over five minutes is not HRV over a night.
What HRV is not is a score for how recovered you are. That is an interpretation layer your device adds on top, and no measurement standard covers it.
Resting heart rate
Resting heart rate is the number of beats per minute when you are doing nothing — in practice, the lowest sustained rate your device sees, usually overnight or shortly after waking.
It is the least glamorous of the three and by some distance the most trustworthy. It is a single number, measured over hours, that does not depend on a proprietary algorithm interpreting it. When something in your physiology genuinely shifts, resting heart rate is often where it shows up most legibly.
Sleep stages
Your watch or ring does not measure sleep. Clinical sleep staging reads brain activity, eye movement and muscle tone; a wrist or finger device sees movement and beat-to-beat heart intervals, and infers the rest.
That inference is better than nothing and worse than people assume. In a laboratory comparison of seven consumer sleep trackers against polysomnography, every device detected sleep very well — sensitivity of 0.93 or higher — but detected wake poorly, with specificity between 0.18 and 0.54. In plain terms: if you are lying still and awake, most devices will score you as asleep. Total sleep time was overestimated by up to roughly three quarters of an hour on some devices. Stage classification was the weakest part of all: every device that scored stages differed significantly from the lab on light sleep, most of them over-reporting it, and on average the devices failed to correctly identify 30–50% of both deep sleep and REM.
So the nightly deep-sleep percentage is not a measurement. It is an index — useful for watching your own number move, close to meaningless as an absolute value.
How much do these numbers move when nothing is wrong?
A great deal, and this is the single most useful fact in the whole guide.
In a 14-day observational study of 41 healthy adults going about ordinary life, the average day-to-day coefficient of variation in HRV was 0.37 — roughly 37% swing around each person's own mean — with individuals ranging from 0.14 to 0.71. They were simply living, and their HRV moved by around a third from day to day while they did.
Which means a single HRV reading 30% below your average is, for most people, an ordinary Tuesday.
Resting heart rate behaves quite differently. In a retrospective cohort of 92,457 wearable users across nearly 33 million person-days, most people had a median weekly fluctuation in resting heart rate of just 3 bpm, and for around 80% the largest weekly swing stayed under 10 bpm. The same study found a seasonal drift of about 2 bpm across the year, peaking in January and bottoming in July.
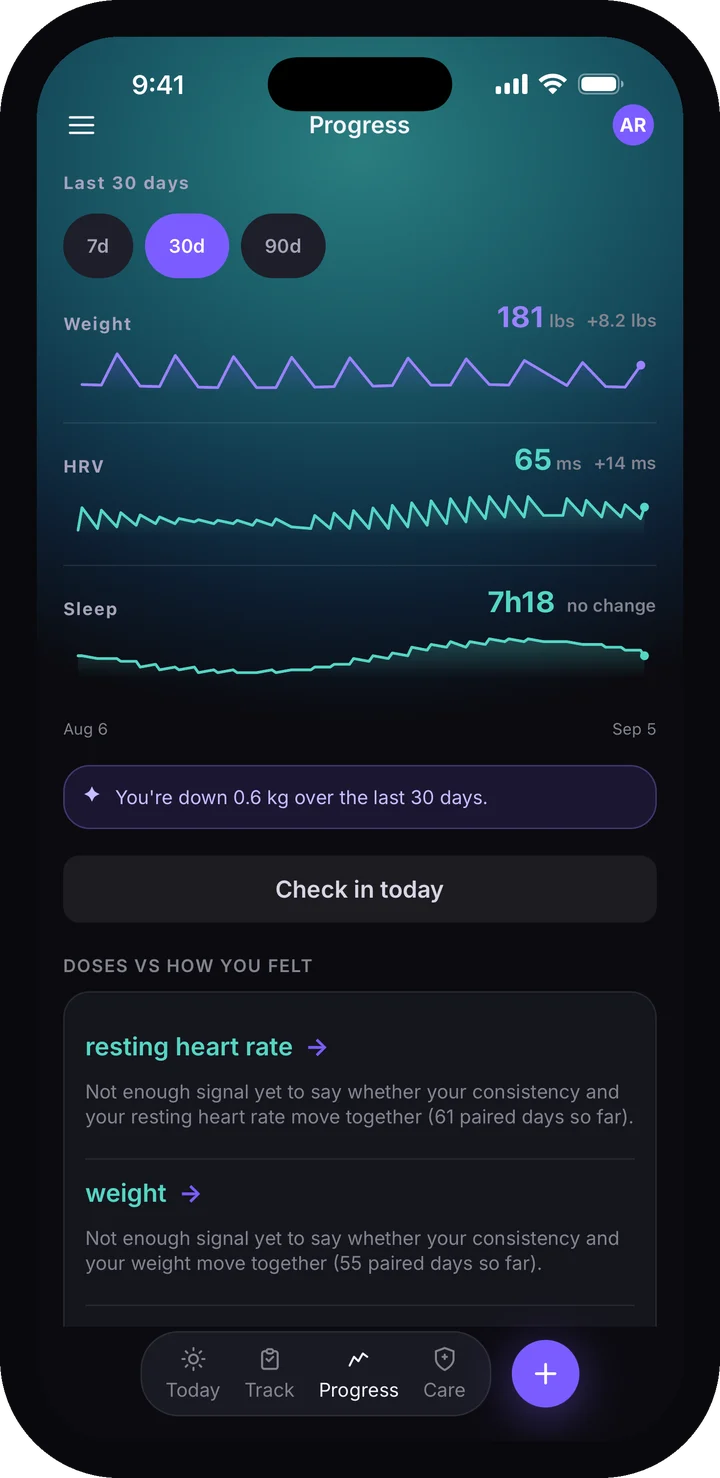
Put those two studies side by side and you have a working rule. Resting heart rate is a quiet signal where a few beats of sustained change means something. HRV is a loud signal where a single day means almost nothing, and only the average of many days is readable at all.
Why is there no "good" HRV number?
Because the spread between healthy people is far larger than the change within any one of them.
That same 92,457-person cohort found individual average resting heart rates ranging from 39.7 to 108.6 bpm — a spread of about 70 beats between one normal person and another normal person. And with HRV it is not only the level that differs between people. In the 14-day study above, how much a person's HRV moved from day to day itself varied about five-fold across individuals — so even the amount of noise you should expect is personal.
Sleep architecture has the same problem. A meta-analysis of 65 studies covering 3,577 healthy people from age 5 to 102 found that the proportion of slow-wave sleep and the proportion of REM both decline significantly with age in healthy adults. Your deep-sleep percentage at fifty is expected to be lower than it was at twenty-five, and nothing has gone wrong.
This is why the percentile ring in your app — "you scored better than 62% of people your age" — is entertainment rather than information. It compares you to a population you are not a member of in any meaningful sense. The only comparison that carries information is you against your own recent history, measured the same way.
Is my wearable a medical device?
Almost certainly not, and it is worth knowing where the line sits.
Most consumer sleep, HRV and resting-heart-rate features are marketed as general wellness features rather than cleared diagnostic tools. The FDA's general wellness policy for low-risk devices sets out when it does not intend to enforce medical-device requirements on products that make only general wellness claims and pose very low risk. That is the category most of this hardware sits in.
A handful of specific features on specific devices — some ECG and irregular-rhythm notifications, for instance — have been cleared separately and are a different matter. But the HRV trend line and the hypnogram almost never are. They are wellness features, and the honest way to read them is as observations you collected yourself, not as results.
What actually moves HRV, resting heart rate and sleep?
More things than you would guess, and most of them have nothing to do with whatever you are trying to study.
Alcohol
Alcohol is one of the largest confounders in most people's data, and its effect is dose-dependent and immediate. In a study of 4,098 Finnish employees recording beat-to-beat intervals during normal life, heart rate during the first three hours of sleep rose by 1.4 bpm after a low intake, 4.0 bpm after a moderate one and 8.7 bpm after a high one, while RMSSD fell by 2.0 ms, 5.7 ms and 12.9 ms respectively.
Read that against the day-to-day numbers above and the implication is stark: a moderate evening's drinking can move your overnight numbers further than most things you are actually trying to measure. If you did not record the drinks, that week of data is telling you a story about alcohol while you read it as a story about something else.
Getting ill
Resting heart rate often rises before you feel unwell. In an analysis of smartwatch data from a cohort of nearly 5,300 people, 26 of 32 confirmed infections showed alterations in heart rate, step count or sleep, and a simple two-tier alert based on extreme elevations relative to each individual's own baseline would have flagged 63% of cases before symptom onset — some by nine days or more.
Note the mechanism there: the detection worked because it compared each person to their own baseline. The population average was irrelevant to it.
Eating late
In a randomised crossover trial in 13 healthy young women, eating dinner an hour before bed rather than five hours before shortened total sleep time by around 26 minutes, cut sleep efficiency, added roughly 13 minutes of wake after sleep onset and raised the arousal index. The authors described the result as reduced sleep continuity rather than simply less sleep.
A late dinner on a Thursday is enough to make Friday's sleep data look like a bad night. If you are trying to read anything subtler than that, dinner time belongs in the record.
Travel, shift work and anything that moves your clock
Circadian misalignment does not just shift when you sleep; it changes what your cardiovascular system is doing. In a forced-desynchrony protocol in 10 adults, living 12 hours out of phase raised mean arterial pressure by about 3% and dropped sleep efficiency from 84% to 67%, alongside substantial metabolic changes.
Practically: a week with a long-haul flight in it is not comparable to a week without one, and neither is the week after. Mark it in the record and read around it.
Where you are in your cycle
For people who menstruate, cycle phase is a systematic, predictable driver of HRV, and ignoring it manufactures trends that are not there. A meta-analysis of 37 studies in 1,004 naturally cycling people found cardiac vagal activity decreases significantly from the follicular to the luteal phase, with a medium effect size, and larger effects still in the comparisons involving the premenstrual phase.
The consequence for anyone reading their own data is concrete. A four-week "decline" in HRV may simply be the second half of a cycle, and the fix is not to look harder but to compare like phase with like phase — this month's luteal fortnight against last month's, not against the follicular one that preceded it.
The same principle applies to anyone whose hormones are being changed deliberately. Someone starting testosterone therapy, someone starting oestrogen or progesterone, someone whose thyroid dose has just been adjusted by their prescriber — all of them are changing a system that influences heart rate and sleep, and none of them should expect a clean comparison across the change.
Training, and everything else
A hard session, a heavy week at work, a poor night, a heavy meal, a warm room, dehydration, a new mattress, a cold coming on, a stressful phone call at 10pm. Each of these is capable of moving an overnight reading. None of them is a medical event.
The measurement itself
The 1996 standards insist on consistent conditions for a reason. A ring worn loosely, a watch that slipped, a night on the sofa, a nap counted as a night, a device that changed its firmware and quietly changed its algorithm — all of these produce a step change in your data that looks exactly like a physiological one. When a number moves abruptly and nothing in your life moved, suspect the measurement before you suspect yourself.
How do I tell a trend from noise?
Four habits, in order of how much they help.
Compare periods, not days. A fortnight against the previous fortnight. A month against the previous month. Never today against yesterday, and never today against your best-ever reading. If you cannot state your claim in the form "the average of these fourteen days differs from the average of those fourteen days", you do not have a claim yet.
Count how many nights the average is made of. A weekly average built from two nights is not a weekly average. Missing nights are not random either — the nights you forget to wear the device tend to be unusual nights, which biases the average in a direction you cannot predict.
Ask what else changed in that window. Alcohol, illness, travel, cycle phase, a new training block, a new job, the clocks going forward. Write them down at the time, because you will not remember them later and the absence of a note reads identically to the absence of the event.
Let resting heart rate lead. It is the steadiest of the three, so a sustained shift in resting heart rate is the most informative single thing in this dataset — and if HRV appears to have moved but resting heart rate has not, be sceptical of the HRV.
Doesn't this mean my medication is working?
No. A pattern in your own data can tell you what happened and when. It cannot tell you why, and this is the section worth reading twice.
Say — as an invented example — your HRV averages 12% higher across the eight weeks since you started something than in the eight weeks before. That is a real observation about your record, and it is worth mentioning at your next appointment. It is not evidence that the medication raised your HRV. At least four other explanations fit the same data exactly as well.
Something else changed at the same time. People rarely start a medication in an otherwise static life. You may also have started sleeping more, drinking less, weighing less, moving more, or worrying less because you finally had a plan. Any one of those could be doing the work.
You were at an extreme when you started. People begin treatment when things are bad, and things that are unusually bad tend to drift back toward ordinary on their own. A measurement taken at a low point will, on average, be higher next time regardless of what you did in between — which is why "I started X and my numbers improved" is the single easiest pattern in the world to produce accidentally.
The season, or simply the calendar, moved. Resting heart rate drifts a couple of beats across the year all by itself. An eight-week comparison spanning a seasonal turn is partly measuring the season.
You looked at enough numbers that something had to move. Your device reports HRV, resting heart rate, respiratory rate, temperature, sleep duration, sleep efficiency, deep sleep, REM, steps. Examine nine metrics after any change and some of them will look different by chance alone. If you decide afterwards which one to pay attention to, you have not found a signal; you have chosen one.
None of this makes the observation worthless. It makes it an observation rather than a conclusion. The honest sentence is "my HRV averaged higher over these weeks", not "this raised my HRV" — and the difference between those two sentences is the whole discipline.
Anything that tells you it has established cause from your wearable data is overreaching. A single person's uncontrolled record, with no randomisation and no comparison condition, is not a design capable of answering that question. It is capable of producing a good question, which is a genuinely valuable thing to bring to somebody qualified to act on it.
What is this data honestly good for?
Three things, all of them real.
Noticing a change early. A resting heart rate that has stayed clearly above your own baseline for several days running is worth knowing about, whether it turns out to be an infection, a poor stretch of sleep or something worth a phone call. This is the use with the strongest supporting evidence, and it works precisely because it is a comparison against yourself.
Putting a rough patch in proportion. When you feel like everything has got worse, a record either confirms it or shows you that the last three weeks were unremarkable and you are remembering the worst two days. Both answers are useful. Only one of them is available without data.
Giving an appointment something concrete. "My sleep has been bad" is hard for a clinician to act on. "My resting heart rate is up about five beats since the start of March, my sleep efficiency has dropped, and it started within a fortnight of the change we made" is a starting point. You bring the observation; they bring the judgement about what it means.
What should I record alongside the wearable numbers?
Wearables collect the part you do not have to remember. The confounders are the part you do, and without them the numbers are much harder to read.
- Alcohol, on the nights there was any. Not a judgement, just a note. It is one of the biggest and most reliable movers in this dataset.
- Illness, with dates. Including the mild ones you worked through.
- Travel and time-zone changes.
- Dose dates for anything you take, including the ones you missed or moved — everything else is read against that timeline.
- Cycle phase, if you menstruate.
- Anything that changed suddenly: a new training block, a new job, a bereavement, a new mattress.
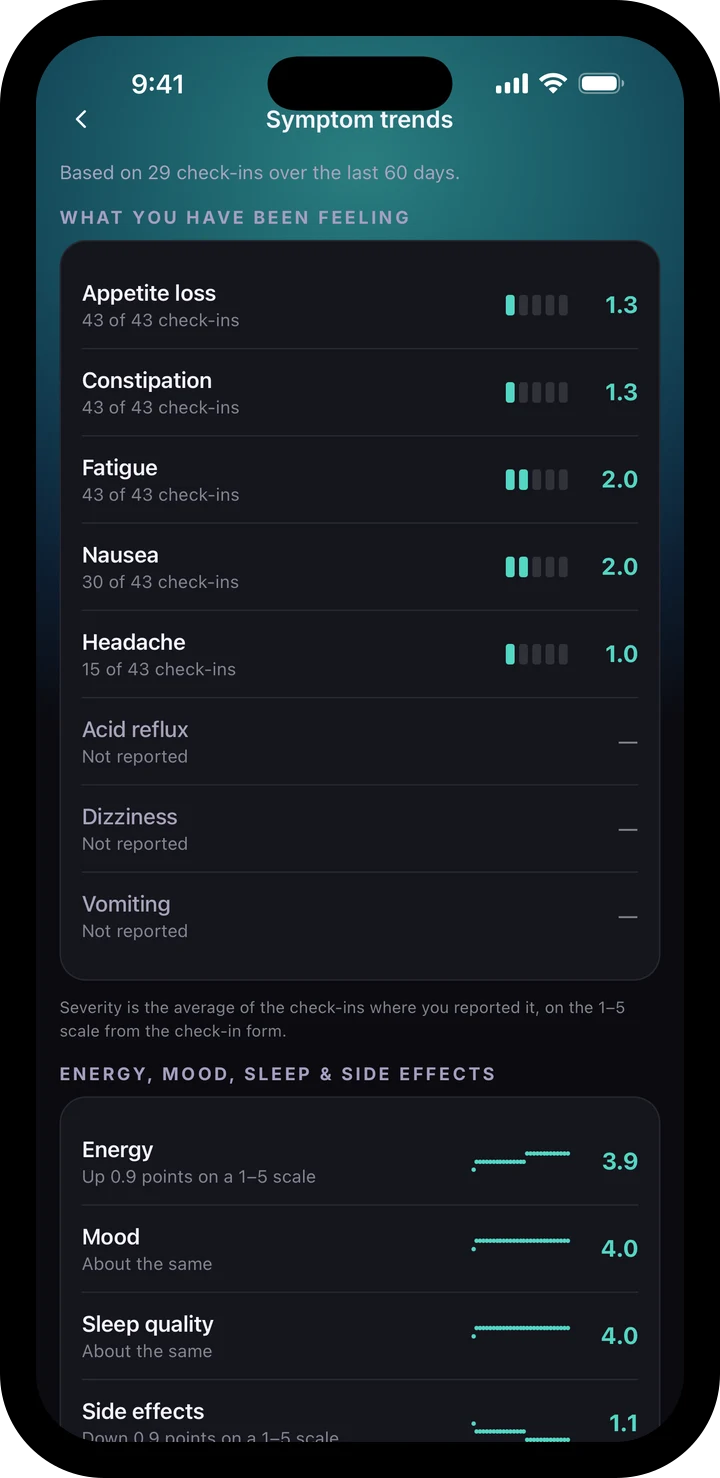
- How you actually felt, on any consistent scale you will keep using. It is the outcome you care about and the one no device records.
The aim is not a bigger dataset. It is that six months from now you can look at a strange fortnight and know whether there was a reason.
What this data will never tell you
It will not tell you what to take, or how much, or when — those are your prescriber's decisions, made with information your wearable does not have. It will not tell you whether a medication is working. It will not diagnose anything. And it will not tell you why a number moved, only that it did and roughly when.
What it does is narrower and more valuable than the dashboards suggest. It gives you a record with dates on it, collected while you were not paying attention, which is exactly the kind of evidence memory is worst at producing. Three months of resting heart rate is not insight. It is a witness — and a witness is a better thing to bring to an appointment than a recollection formed in the car park.
Lumara is a tracking and education tool. It is not a medical device, it does not diagnose, and it gives no dosing advice — it keeps the record so that the person qualified to read it has something better than your memory to work from.
Track what goes in. See what comes out. Then let someone qualified tell you what it means.