
Your ring said 38 this morning. Your brother's said 94. He is six years older than you, sleeps worse, and hasn't run since March. So what exactly is wrong with you?
Nothing, probably. (Those two figures are illustrative — but a gap that size is an ordinary one.) You have just done the one thing heart-rate variability cannot survive — compared your number to somebody else's.
HRV is one of the more interesting things a wearable gives you and one of the easiest to misread, because it arrives as a single tidy figure that looks like a score. It isn't one. Here is what it measures, and what a defensible reading of it looks like.
What is HRV actually measuring?
HRV is the small variation in the time between consecutive heartbeats, and that beat-to-beat variation is largely a readout of how much your vagus nerve is braking your heart.
A resting heart rate of 60 does not mean one beat every second on the dot. The intervals wobble — 1.02 seconds, then 0.96, then 1.01. HRV is that wobble, reported in milliseconds.
Your heart sits between two opposing controls. The sympathetic branch accelerates and works over tens of seconds; the parasympathetic branch — the vagus nerve — brakes, and acts almost instantly, beat by beat. Only the vagal side is fast enough to change the gap between one beat and the next, so short-term variation is mostly a vagal signal. You can feel it: breathe in and your heart speeds slightly, breathe out and it slows again.
The specific figure most rings and watches report is RMSSD, the root mean square of successive differences between beats. It is one of the standard time-domain measures defined by the 1996 ESC/NASPE Task Force standards, and as a 2017 review of HRV metrics and norms puts it, RMSSD "is the primary time-domain measure used to estimate the vagally mediated changes reflected in HRV."
It is not a grade for your nervous system. It is one proxy, for one branch of it, over one short window.
What is a good HRV number?
There isn't one. The range across healthy adults is so wide that your figure, on its own, tells a stranger almost nothing about you.
A systematic review of short-term HRV in healthy adults pooled 44 studies covering 21,438 people. Across the studies reporting it, RMSSD averaged 42 ms, with reported values spanning 19 to 75 ms. The same review found "large interindividual variations (up to 260,000%), particularly for spectral measures", and identified a string of methodological discrepancies between labs underlying the disparate figures.
Two structural reasons the comparison fails. HRV declines with age, so a woman of 52 and a man of 34 are not on the same scale to begin with. And the sexes differ in which metric runs high: the 2017 review notes women show lower SDNN than men while showing relative vagal dominance despite a higher average heart rate. Rank two people on one figure and you are largely ranking their demographics — and their resting heart rates, since a faster heart rate leaves less time between beats for the intervals to vary, which that review calls cycle length dependence.
Even your own figures aren't interchangeable across formats: 24-hour and short-term measurements, the 2017 review notes, "cannot substitute for each other and their physiological meaning can profoundly differ."
The only comparison that carries information is you against you, measured the same way.
Why does my HRV swing so much from night to night?
Because the number is unusually sensitive to the conditions it was recorded under — posture, breathing rate, time of day, and what you did in the hours beforehand.
The ESC and EHRA joint position statement on HRV analysis says it plainly: "The recording conditions (duration, body position, free or controlled breathing, etc.) can substantially affect short-term metrics, thus making comparison of different studies challenging."
You can see the size of the problem in what researchers control for. A widely used methodology paper on HRV in psychophysiological research asks for a fixed seated posture with five minutes of acclimatisation, no coffee or tea and no food in the two hours before, no alcohol in the previous 24 hours, no hard training the day before, a normal night's sleep, and the same time of day for every repeat measurement.
Alcohol on its own is enough to move the figure. An observational study of 4,098 Finnish employees covering 12,411 recording days compared each person's drinking days against their own alcohol-free days. During the first three hours of sleep, RMSSD fell by 2.0 ms after low intake, 5.7 ms after moderate and 12.9 ms after high, while heart rate rose by 1.4, 4.0 and 8.7 bpm across the same three levels. Note the design: every comparison is within one person, which is why it is readable.
A single low reading may say more about last night than about you.
Can I trust the number my ring or watch reports?
For the direction of travel, largely yes. For the absolute value, less than the display implies — and never across two different devices.
Consumer wearables estimate beat intervals optically, from blood-volume changes at the finger or wrist. How well that survives contact with a real ECG depends on the metric. In a comparison of a consumer ring against chest ECG across 35 adults' overnight recordings, nocturnal heart rate and RMSSD tracked ECG closely in five-minute windows (r = 0.993 and 0.915), while SDNN (r = 0.518), LF (0.424), HF (0.627) and the LF:HF ratio (0.355) did not. Averaging across a whole night pulled most of them back above r = 0.82. The same study found ring RMSSD running roughly 15 ms below ECG in five-minute windows — a consistent offset, which a trend absorbs and a comparison does not.
Plainly: HRV on consumer rings and watches is a general-wellness feature, not a cleared diagnostic measurement — the FDA's general wellness policy for low-risk devices is the guidance under which such features ship without clearance. Devices also differ in sampling window, artefact filtering and algorithm, so two can report two different figures for the same night. Changing device resets your baseline; the old readings are not a continuation of the new ones.
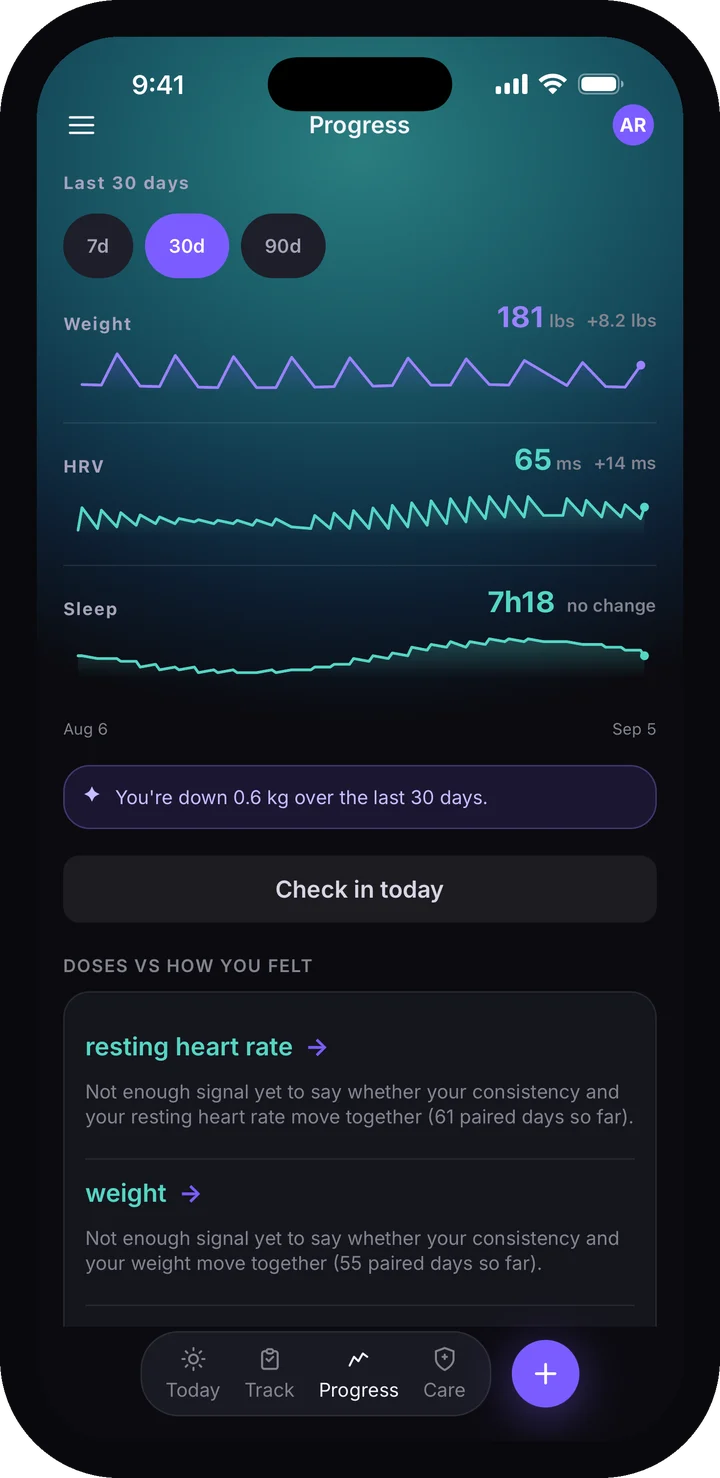
Illustrative screen — the figures shown are sample data, not a real person's record.
How long before a trend actually means something?
Weeks. And the unit worth reading is a rolling average against your own baseline, not this morning's figure.
This is the part of HRV interpretation with real practical literature behind it, mostly from endurance sport. A 2013 review of HRV monitoring in elite endurance athletes set out the methodological problems with using HRV as a day-to-day monitoring tool, offered "the use of appropriate averaging techniques" as part of the fix, and concluded that it takes longitudinal monitoring to understand an athlete's "unique individual HRV fingerprint". A follow-up study in trained triathletes asked how many days a weekly average needs to match the full seven-day one, and told practitioners to "use a minimum of 3 (randomly selected) valid data points per week".
So an honest HRV statement has a shape to it: my seven-day average has sat above my own longer-run baseline for three weeks now. "My HRV was 41 this morning" is not a statement about anything.
It follows that the first month with a new wearable is baseline-building, not insight: you cannot detect a departure from normal before you know what your normal is, including how widely it swings in an ordinary week.
Does HRV tell me whether my medication is working?
No. At most it can show that something in your own trend moved around the time your protocol changed, which is a question to bring to your prescriber rather than an answer.
HRV responds to sleep debt, a cold coming on, a hard gym session, alcohol, a stressful fortnight, a long flight, and the hour it was captured. Any change to your treatment is one line in a crowded ledger. A trend that shifts alongside it is worth showing someone; it is not evidence of cause, and never a reason to change what you take. Your prescriber decides that, and what they need from you is the record, not the interpretation.
What makes the record worth having is context. A trend line by itself is a shape; the same line alongside what you took, when you took it, how you slept and what else was going on that month is something you and a clinician can read together. That is the argument set out in Why trust Lumara: the number is yours, the only comparison that counts is against your own history, and the reading belongs to you and the person treating you.